When students can verbalize and describe a graph, they can also recognize features of a graph or a function. This is the first step for describing and sketching qualitative features of a graph. I used to show graphs and have question and answer sessions about what was happening in the graph. I would ask questions like: Where is the graph increasing? What does that mean? Where is the minimum? What is the maximum of the graph?
This was a good start and helped students see how graphs are not just lines and curves. Students started to see how graphs can describe a set of data or situation. However, it was very directed and one sided. I wanted to hear how the students described the graph. I wanted to see if they could draw a graph or interpret the words. So one day, during some down time, I saw my students playing a drawing game: A student drew a picture and her team had to guess. This was brilliant! The students were talking, trying to choose their words wisely, and students were drawing and adjusting their sketches. This was my answer. This is how I can help my students learn and describe graphs! But I wanted to go a step further. What about charades? This could add another element to our guessing game. One student secretly looks at a graph, and now has to ACT IT OUT! Then the other students have to try and sketch it and describe it, and find the matching cards. It’s like a 3 person pictionary/charades/matching game.
Set up for the Lesson: Describe and Sketch Qualitative Features of a Graph
- Make teams of 3-4 students.
- Print out copies of the cards for each group.
- Print out blank graph paper or coordinate planes for sketches.
- Provide each student with the Describe and Sketch Qualitative Features of a Graph Worksheet.
Launch the Lesson: Describe and Sketch Qualitative Features of a Graph
Students should already be familiar with the coordinate plane and basic line graphs. They also should have an introduction of what a function is and how functions can be shown as a graph. In this lesson, they do not need to write an equation for the matching function graphs. These graphs are more complicated than a linear function and may even be a combination of multiple functions. The point of the exercise is to help students recognize features of graphs such as:
- Where is it increasing?
- Where is it decreasing?
- What is the minimum? How do you know?
- What is the maximum? How do you know?
- Is there a section of the graph where there is no change? Constant?
- What does it mean when the graph is a horizontal line?
- What does it mean when the line is steeper?
One way to introduce the lesson as well as generate a list of good mathematical ways to describe a graph is to start with an example. But don’t just show a graph, have students use a blank coordinate plane and draw a graph with you.Tell the students that you will be describing an everyday situation and everyone will try to make a graph of it.
Guide them through the first description and draw a graph with them on the board.
Start by introducing the coordinate plane. Say something like: “Here’s our coordinate plane. For this graph, we are going to start at the origin.” Point to the origin. Then say “We are going to describe and graph a simple drive to the store for my car. Are you ready? Well, the origin is my house. That’s where my car is parked in the morning when I wake up. It’s not moving yet.” Put a dot on the origin then say “I get in my car and start it, this is when time starts. As time ticks away, let’s see what my car does. The x axis represents time. The y values are going to show my distance from my house. 0,0 is time zero, distance zero – this means I haven’t left my house yet.”
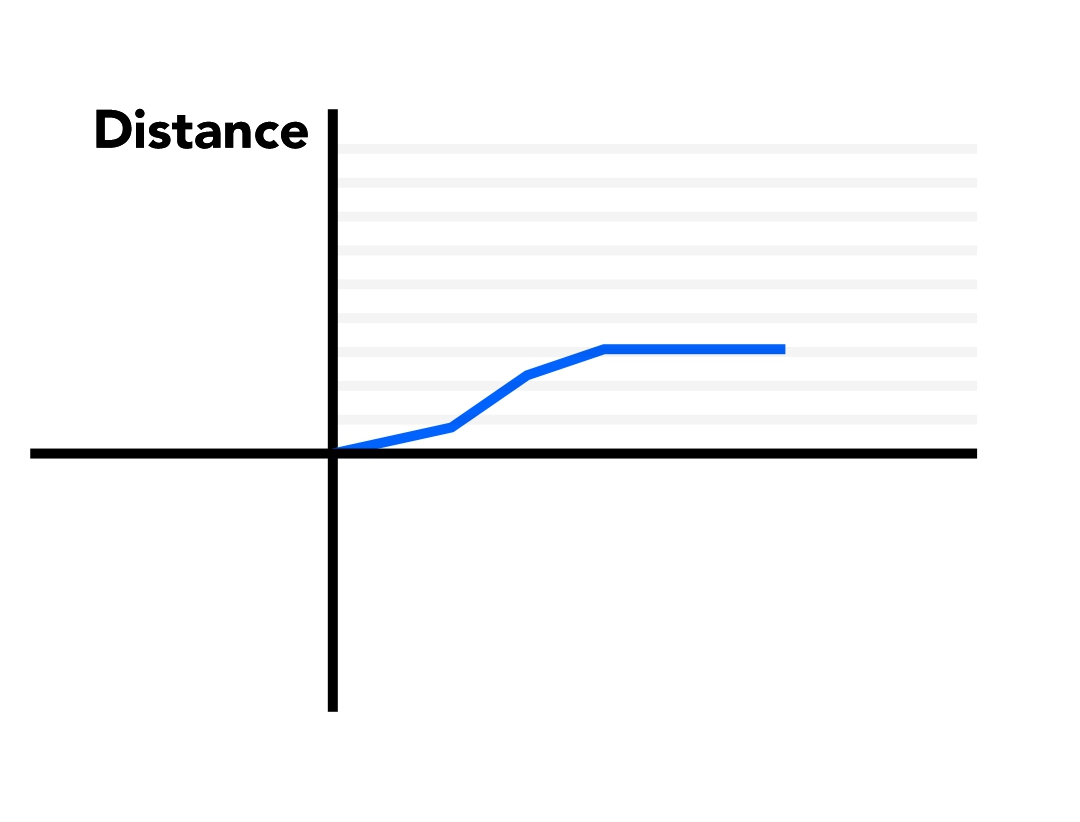
Start drawing a graph slowly slanting up away from 0,0. Say: “As I start driving, I get farther from my house over time” Show a graph. “Is this line increasing or decreasing? Why?” Wait for responses.
Then say “Let’s say I get to the store and park.” Stop the increasing line. “Now my car is stopped again, and it will sit there until I start driving again. What do you think this does to the graph? ” Wait for answers. Some students may say that it stops, others may say that it drops to zero. The correct answer is that it stays steady, flat, horizontal line, because time is still ticking away, and the car is remaining a constant distance from my house.
Your graph should look similar to the sketch below:
This is a good place to stop and record ways to help describe the graph. Have students write down key words that they may use during the charades game. Words like:
- Constant
- Zero
- Increasing
- Decreasing
- Maximum
- Minimum
- Steeper, less steep
- Flat, horizontal
Have students share their graphs. Some may look a bit larger or smaller, but that’s ok! The idea is that the graphs show the same increasing or decreasing areas.
To finish the graph, you can ask students what it will look like when you drive back home. To keep it simple, at the end of the shopping trip, you can say that you get back in your car and drive straight home. Let the students try and draw this part of the graph themselves. Then show your answer – similar to this:
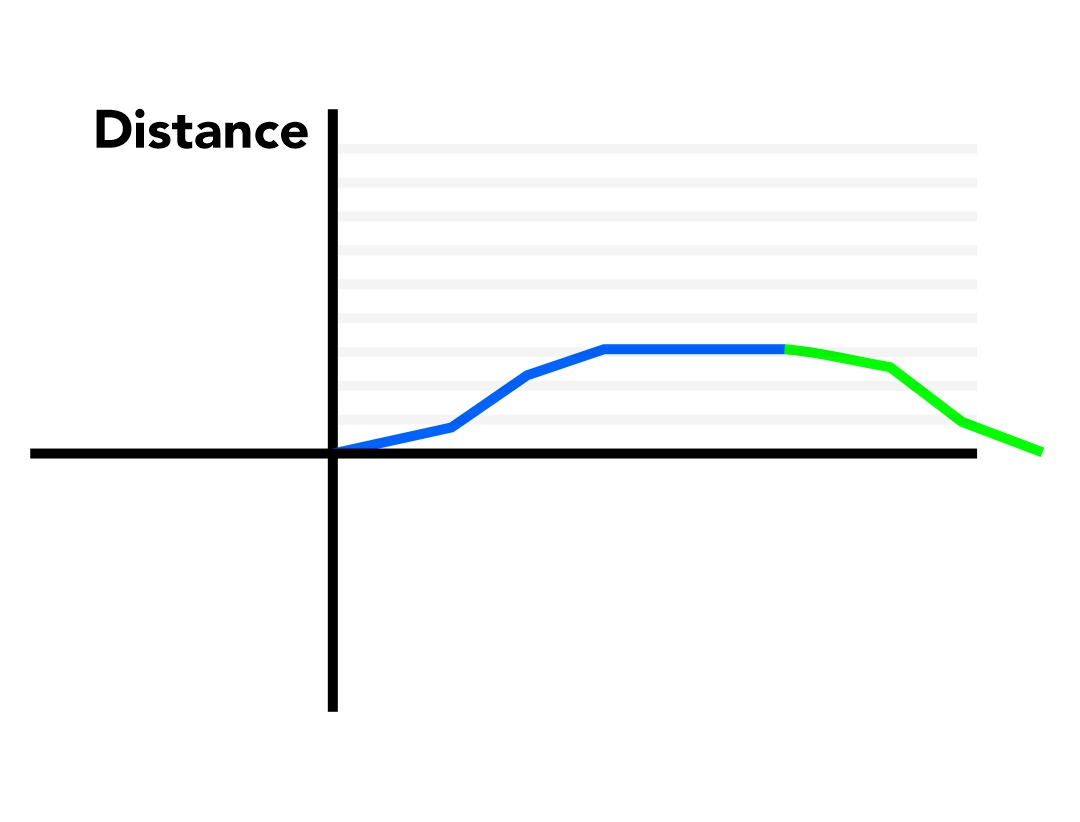
It’s ok if the lines are not completely symmetrical. You can discuss factors that may help the line be steeper or less steep. Students often like this, they come up with ideas like “There was traffic.” or “You drove faster.”
Once students have their graphs, they can compare and share. Remember to tell them that they all may look a bit different, but the graphs should all show the same trends of distance over time.
Ask for a volunteer to share their graph. Hold up the graph or draw it on the board. Use this to SHOW students how to act it out. Maybe you can stand to one side and say: “Pretend I’m the car, and this is my house. Right now I’m zero miles from home. As I drive, I move farther away from the house.” Walk away from point zero. “Look at my distance from home? Now I’m farther away.” Then stop and point to the graph and show how the graph indicates the distance over time. “Here, where the graph is flat, we can see that the car is a constant distance away from home. If I stand still, at this distance, I am showing time clicking away, but the distance remains the same, just like this line”. Then start walking back towards your starting point and ask “What’s happening in the graph when I walk back to point zero?”
Now that you have shown a way to act it out, you could ask for questions and/or your volunteer to try.
Now that students have an example of sketching a graph, describing, and acting out a graph, you can introduce the activity. Explain that they will be playing a game of charades. One student, the actor, needs to act out a graph. The other students need to try to describe and sketch the graphs and see if they can find the matching cards!
Describe and Sketch Qualitative Features of a Graph: Charades and Matching Activity
Introduce the activity, roles and supplies.
For each round, the students have a specific role. They will rotate roles as they move through the different rounds.
Roles: Actor, Sketch Artist, Wordsmith
Supplies: Graph cards, description cards, blank coordinate planes, pencils
Instructions for Students:
- Pick a role, for the first round.
- Actor picks a graph card and does not show it to anyone!
- Actor must act out the graph with his/her body. He/she can purely act it out or describe a situation like driving to school, but should avoid just describing the shape of the graph (that’s what the word smith needs to do).
- Wordsmith and Sketch Artist can shout out ideas to each other to get feedback from the actor. Things like: “It’s increasing!” or “You stopped, that’s constant!”
- The Sketch Artist tries to sketch the graph by using the actor’s clues and the descriptions.
- Once the sketch artist is done, the wordsmith looks through the description cards and tries to find the best match. The sketch artist uses his/her own sketch to find the best matching graph.
- The actor reveals their graph and the group discusses whether they have the correct card and an accurately drawn graph to match.
- Rotate roles. Then play again!
As the students are playing, walk around and help with descriptive words or suggestions for the actors. Make sure each student is able to try each of the different roles. Let the students play and describe for a few minutes before they start looking for the matching cards. If students are having difficulty, allow them to look for matches before the sketch is finished.
At the end of the game, students should have rows of matches: The original graph card, the description card, the drawing from the sketch artist, and the chosen graph to match. It’s ok if they are wrong! These are good ones to discuss what features make them not match. Sometimes the words match and the graph does not, or maybe the graph matches exactly and the words do not.
Reflecting on the Activity
Students should reflect after each round. They can record or discuss good words and ways to describe or draw in order to help them with the next rounds.
At the end of the activity reflect and share some of the following
- Which role was the most difficult?
- Which role did you like the best?
- What descriptive words did you use the most?
- How do you know when there is a minimum or maximum?
Students also have questions on the worksheet as well as practice problems.
Extension activities
Graphing Stories – website with situations and what the graph would look like. This is also a good way to introduce the activity.
Students choose an activity/sport or something about themselves, then create a graph and describe it. For example: Height of a basketball from a free throw over time
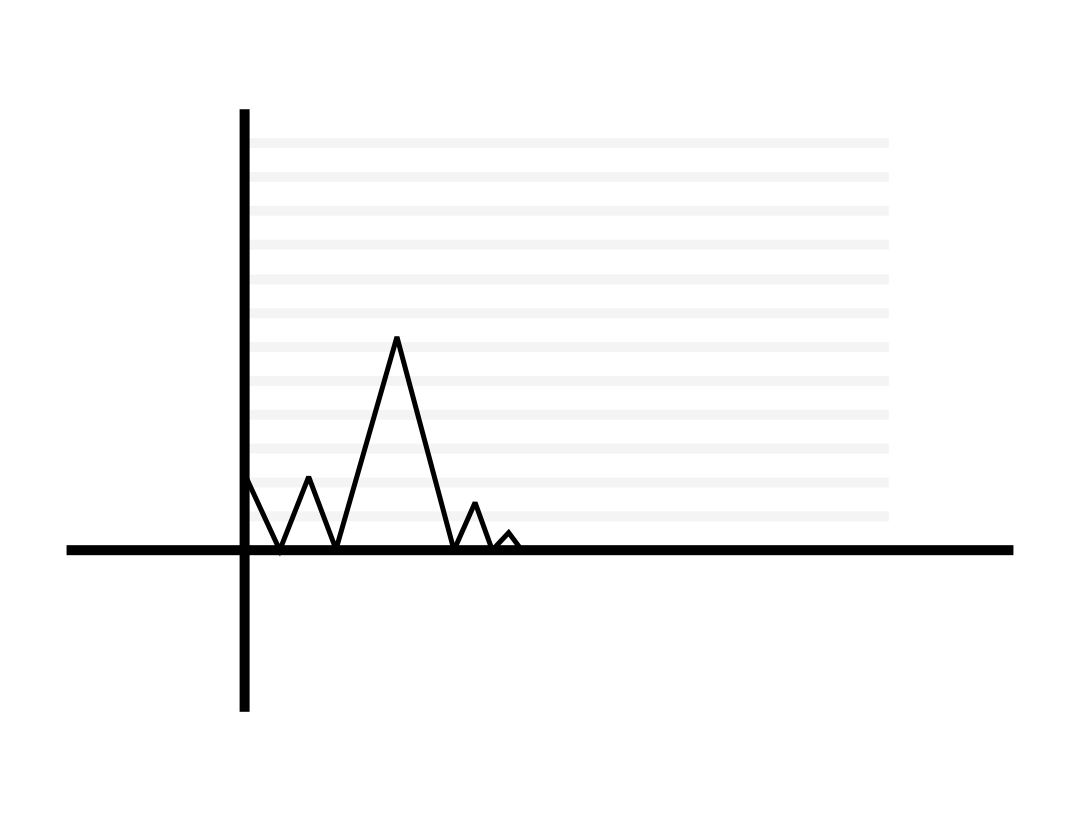
The person dribbles the ball, the height decreases, then the ball bounces back up, increases height, ball decreases and increases again on a bounce. Then the person shoots it, increases height, and scores. The ball decreases, hits the ground and bounces back up, increasing. The Maximum is where the ball was shot in the basket. The Minimum is when the ball bounced on the ground.